
Although the EB-5 Immigrant Investor Program is considered one of the fastest and easiest ways to immigrate into the United States, applicants are still often subject to long wait times in the EB-5 process. This is especially true if the applicant is from a country with visa backlogs. The available data and estimated processing times can be difficult to interpret, which makes it difficult for EB-5 applicants to estimate their potential wait time in the process. However, understanding the available data and which factors affect wait times can be immensely helpful in predicting whether an applicant will face delays.
It’s important to understand how EB-5 visa availability works. Approximately 10,000 visas are allocated to the EB-5 program each fiscal year. Of those 10,000 visas, each country is supposed to receive no more than 700. However, these numbers are not set in stone and can change year to year. In fact, it’s expected that there will be an increase in the number of visas allocated to the EB-5 program in FY2021. There could be up to 14,000 available EB-5 visas in FY2021.
Because of the various stages of the EB-5 process and the non-linear I-526 petition processing, it is difficult for investors to properly understand the EB-5 visa queue. It can be calculated in a few different ways, each attempting to make up for the lack of data published by United States Citizenship and Immigration Services (USCIS).
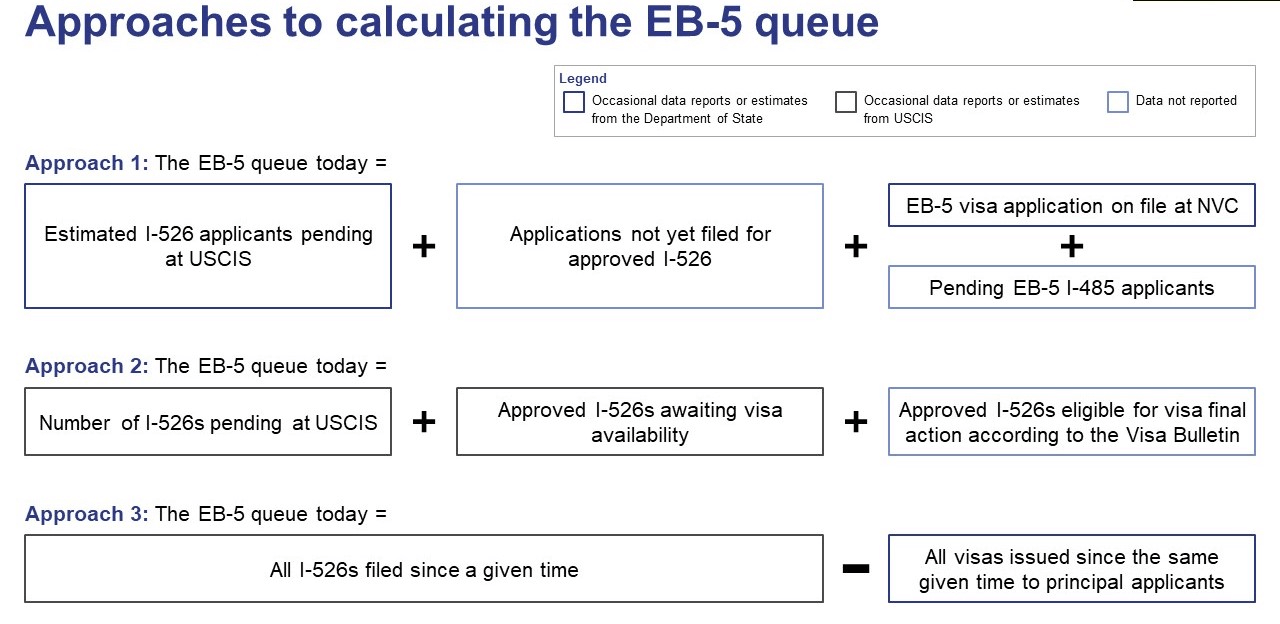
One way to break down the EB-5 visa queue is in terms of USCIS and the Department of State, which is the same approach used by Visa Control Office Chief Charles Oppenheim. He uses this method to calculate the EB-5 visa estimated wait times. However, his calculations only include EB-5 investors with pending I-526 petitions and pending applicants at the National Visa Center (NVC). They do not include EB-5 applicants who have already received I-526 approval but haven’t submitted a visa application, nor do they include applicants with pending I-485 petitions. These populations are omitted from the calculations due to a lack of data, which could lead to inaccurate data.
Another way of looking at the EB-5 queue is to divide it by I-526 approval and visa availability. As of August 2020, USCIS recently began releasing the number of EB-5 investors with I-526 approval who are waiting for visa availability, making this approach possible. The only figure that this approach does not include is EB-5 applicants waiting for their priority date to become current. While this approach is still not completely accurate, it does address part of the issue of the first approach.
The final method for calculating the EB-5 visa queue is the simplest. The third approach simply subtracts the number of visas issued since a certain date from the number of I-526 petitions filed since the same date. Although this approach avoids some of the gaps of the first two methods, it does not consider where investors are in the EB-5 process.
A Look at Data from November 2019 and April 2020
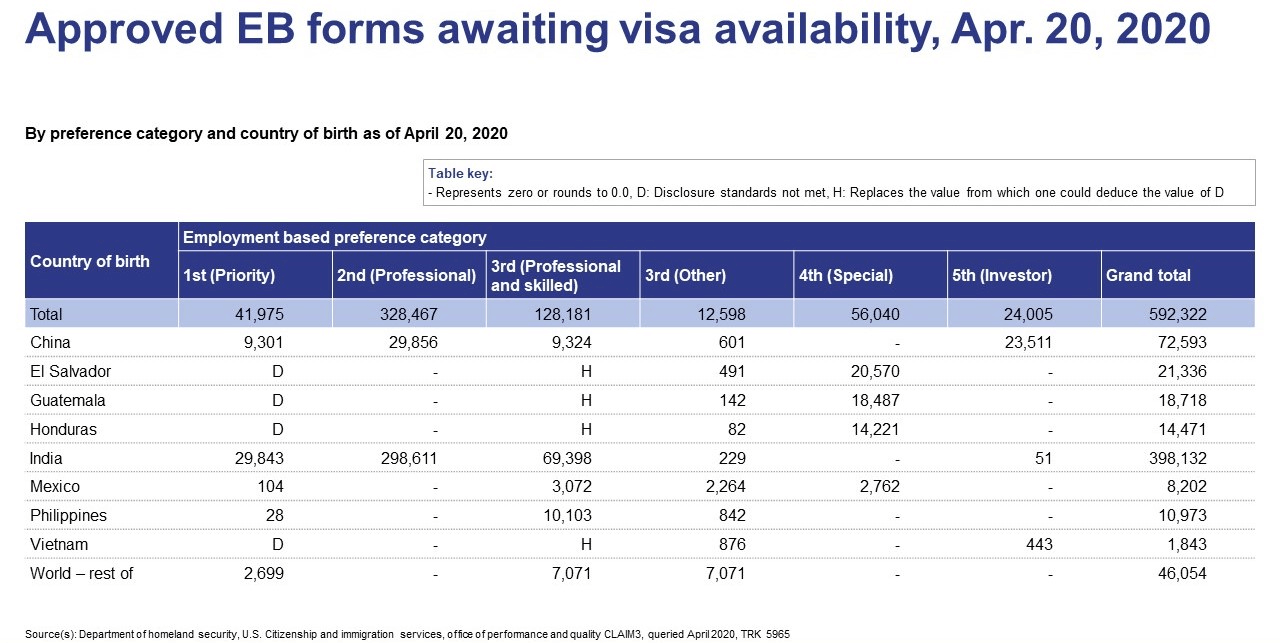
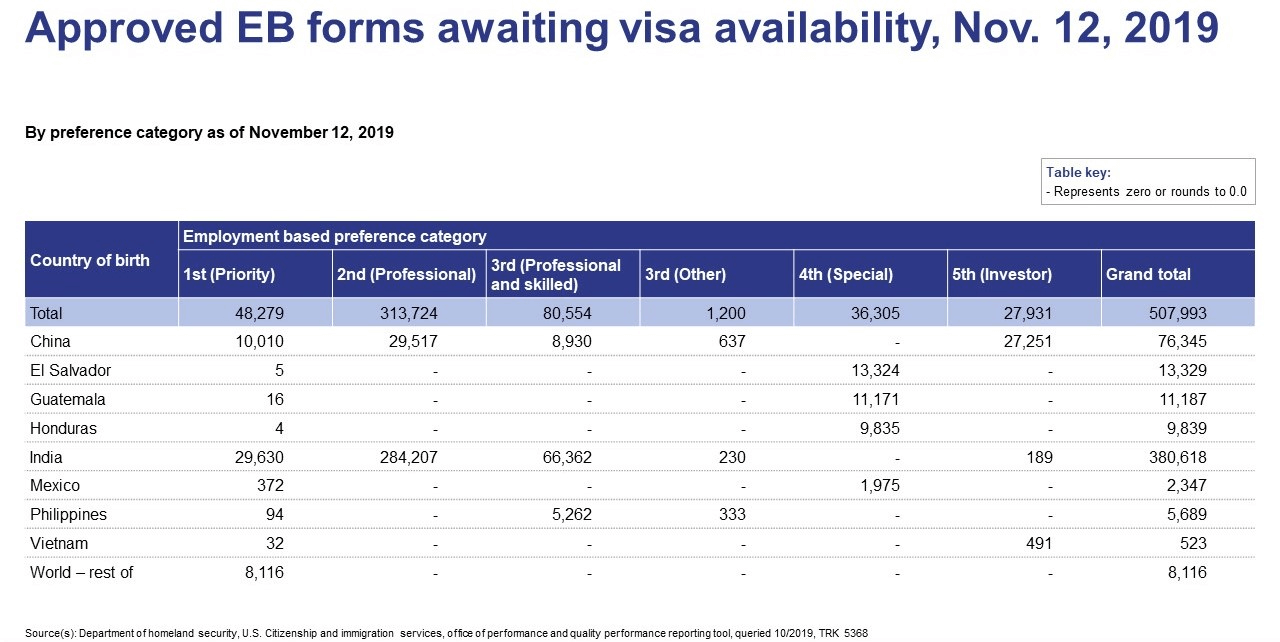
Below are two tables that show the number of EB-5 applicants who have I-526 approval but are waiting for visa availability. The first chart is from April 2020, and the second is from November 2019.
EB-5 Visa Figures for China
The data clearly shows a decrease in the number of approved Chinese EB-5 investors waiting for visas to become available. In November 2019, there were 27,251 investors waiting on visa availability but only 23,511 awaiting visa availability as of April 2020. In November 2019, the Chinese EB-5 final action date was November 1, 2014. This date moved forward to May 15, 2015, by April 2020. This increase in the final action date only accounted for an extra 3,740 investors. This does not mean that thousands of Chinese investors received visas—it just means that there are more Chinese investors with visas available.
Many EB-5 investors also applied for visas for their spouse and children. Historically, each Chinese EB-5 investor has received 2.7 visas. This means that there would need to be 63,889 EB-5 visas available in April 2020 in order to account for all the applicants waiting for their priority dates to become current.
EB-5 Visa Figures for India
The numbers for India are much lower than China. In November 2019, 189 Indian EB-5 investors were awaiting visa availability, and that number dropped to 51 in April 2020. The final action date was December 8, 2017, in November 2019 and jumped all the way to January 1, 2019, by April 2020. This rapid advancement led to a “current” final action date in July 2020. Once visas for family members are considered, the 51 awaiting visa availability increases to 124. However, the Department of State still has 200 visas to allocate to Indian investors in FY2020, which may be enough to completely clear the Indian backlog in FY2020.
EB-5 Visa Figures for Vietnam
The figures for Vietnam show the smallest change over this time period. As of November 2019, there were 491 Vietnamese EB-5 investors awaiting visa availability, and that number decreased to 443 by April 2020. The small change in this number suggests either a large number of I-526 approvals and large number of investors who reached a current final action date, or a small number of I-526 approvals and a small number of investors reaching the final action date.
Vietnam’s final action date has not moved forward as rapidly as India’s. From November 2019 to April 2020, the final action date advanced from November 15, 2016, to February 8, 2017. The slower advancement of the final action date is due to fewer visas being available to Vietnamese investors. When the EB-5 investors’ spouses and unmarried children younger than 21 are factored in, the number of visas required for Vietnamese EB-5 investors in FY2020 exceeds 800, which means it’s unlikely the Vietnamese backlog can be cleared in FY2020.